

Market Outlook · ahmed alhajri · October 4, 2026
Umm Al-Qura Cement (3005) share price receives some support – Daily Forecast – 04-10-2026
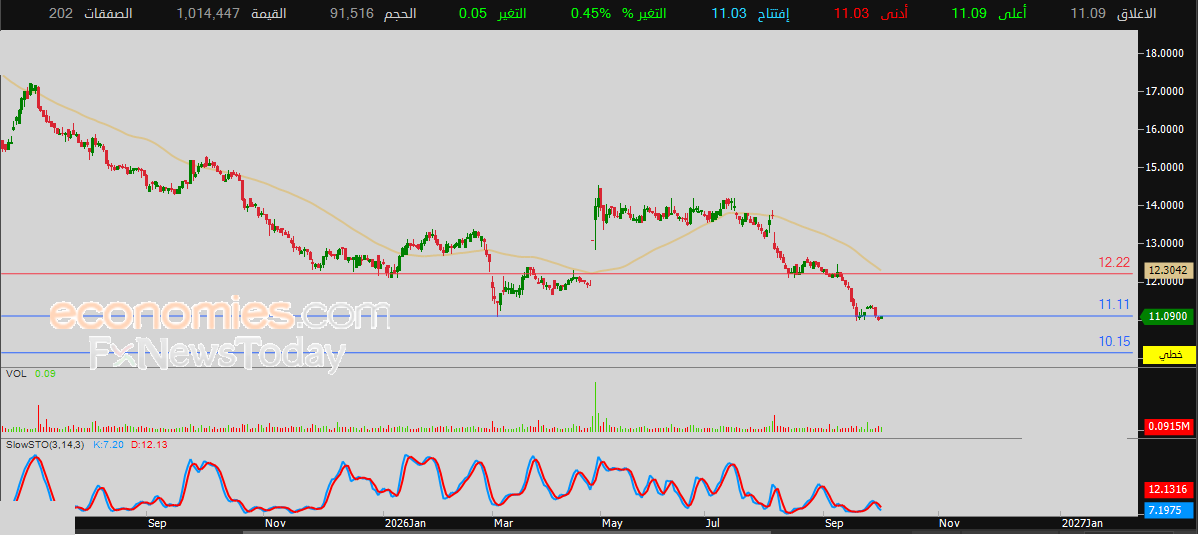
The share price of Umm Al-Qura Cement (3005) advanced slightly in its recent intraday trading, supported by the consolidation of the pivotal support level at 11.11 SAR. This provided some positive momentum, helping the stock recover some of its previous losses, despite the dominance of the main bearish trend in the medium and short term. The stock continues to face negative pressure from trading below its 50-day simple moving average, while negative signals emerge from the Relative Strength Index (RSI) after the stock managed to shed some of its oversold status, increasing the negative pressure around it. Therefore, our forecast suggests a decline in the share price in upcoming trading, especially if it breaks the aforementioned 11.11 SAR support, targeting the next support level at 10.15 SAR. Bitcoin (BTCUSD) declined in its recent intraday trading following the consolidation of the pivotal resistance level at $87,000. The price is attempting to gain positive momentum to recover and breach this resistance while simultaneously trying to shed some of its clear overbought status in the RSI, especially as negative signals begin to appear. This occurs amid the dominance of the main bullish trend in the short term, supported by a sub-trend line and positive pressure from trading above the 50-day simple moving average, which enhances the chances of a recovery in the near term. Crude Oil prices advanced in recent intraday trading, supported by the consolidation of the pivotal support level at $89.00, which provided positive momentum to recover some previous losses. This comes amid the dominance of the short-term corrective bearish trend, with the price moving along a trend line that supports this path, alongside negative pressure from trading below the 50-day simple moving average and negative signals from the RSI. Gold (GOLD) prices slipped lower in recent intraday trading after hitting resistance at its 50-day simple moving average, coinciding with the consolidation of the $4,200 resistance level. This exposed the price to double negative pressure under the dominance of the short-term main bearish trend, with movements along a supporting trend line, while negative signals from the RSI began to emerge after reaching overbought areas.
Related articles
- BATIC (4110) share price faces negative pressure – Daily Forecast – 04-10-2026
- Fourth Milling Company (2286) share price remains unchanged amid negative pressure – Daily Forecast – 04-10-2026
- Ataa Educational (4292) share price deepens losses – Daily Forecast – 04-10-2026
- Sinad Holding (4080) share price rises on pivot support impact – Today's forecast – 04-10-2026
- TALCO (4143) share price moves within a narrow sideways range – Daily Forecast – 04-10-2026
- DBS Stock Price (7205) Tries to Recover Some of Its Losses – Today's Forecast – 04-10-2026